上一篇已经把 Prometheus Server 部署起来了,并且让 Prometheus 先采集了自己的 /metrics 接口。这个最小闭环可以证明 Prometheus 的配置、启动、抓取和查询链路是通的,但它还不能回答主机层面的问题,比如 CPU 是否繁忙、内存是否紧张、磁盘空间是否够用。
这篇继续在同一台 Hadoop/YARN 实验服务器上补两个组件:
- Node Exporter:把 Linux 主机指标暴露成 Prometheus 能识别的 /metrics 接口。
- Pushgateway:给生命周期较短的脚本或批处理任务提供指标暂存入口。
部署完成后,Prometheus 中会有三个采集任务:prometheus、node_exporter、pushgateway。
1. 组件作用
先把这两个组件的边界说清楚。
| 组件 | 默认端口 | 适用场景 |
|---|---|---|
| Node Exporter | 9100 | 采集 Linux 主机 CPU、内存、磁盘、网络、文件系统等指标 |
| Pushgateway | 9091 | 暂存短任务主动推送的指标,再由 Prometheus 拉取 |
Node Exporter 适合长期运行的主机。它本身只负责暴露指标,不保存历史数据,也不做查询。Prometheus 定期访问 http://主机:9100/metrics,把这些指标采集到自己的 TSDB 中。
Pushgateway 的定位不一样。它不是给普通服务长期推指标用的,更适合一次性脚本、定时任务、离线批处理这类生命周期比较短的任务。比如一个巡检脚本只运行 2 秒,Prometheus 每 15 秒抓一次,很可能抓不到这个脚本自身暴露的指标。这时可以让脚本在退出前把结果推到 Pushgateway,Prometheus 再从 Pushgateway 采集。
这里要先明确一个边界:Pushgateway 不是把 Prometheus 从 Pull 模型改成 Push 模型的通用方案,它主要服务于短生命周期任务。普通长期运行服务仍然应该优先暴露 /metrics,让 Prometheus 直接拉取。
2. 环境说明
本次继续使用上一篇的服务器:
hostname
date '+%Y-%m-%d %H:%M:%S'
输出如下:
lavm-bzoq5mwl1h
2025-04-18 09:33:30
当前使用的组件版本如下:
/opt/module/node_exporter-1.9.1/node_exporter --version
/opt/module/pushgateway-1.10.0/pushgateway --version
输出如下:
node_exporter, version 1.9.1 (branch: HEAD, revision: f2ec547b49af53815038a50265aa2adcd1275959)
  build user:       root@7023beaa563a
  build date:       20250401-15:19:01

pushgateway, version 1.10.0 (branch: HEAD, revision: 17dd0704c6595396b8ca2550884bd9f0d66990bb)
  build user:       root@ef8599d2814a
  build date:       20240919-21:18:11
本文使用的版本如下,阅读时如果已经有更新版本,可以到 Prometheus 相关组件的 GitHub Releases 页面替换为更新的稳定版本。包名里的 linux-amd64 对应 x86_64 服务器,如果是 ARM64 服务器,需要选择 linux-arm64 包。
本机测试 localhost 不需要开放云服务器安全组;如果要从浏览器远程访问 Prometheus、Node Exporter 或 Pushgateway,对应端口需要被安全组或防火墙允许。但公网开放前必须先做好访问控制,不能只因为实验方便就长期裸露这些端口。
3. 部署 Node Exporter
先下载并解压 Node Exporter:
mkdir -p /opt/software /opt/module
cd /opt/software

curl -L -o node_exporter-1.9.1.linux-amd64.tar.gz \
  https://github.com/prometheus/node_exporter/releases/download/v1.9.1/node_exporter-1.9.1.linux-amd64.tar.gz

tar -zxf node_exporter-1.9.1.linux-amd64.tar.gz -C /opt/software
mv /opt/software/node_exporter-1.9.1.linux-amd64 /opt/module/node_exporter-1.9.1
这里仍然把安装包放在 /opt/software,正式运行目录放在 /opt/module。如果 /opt/module/node_exporter-1.9.1 已经存在,需要先备份旧目录,确认不需要后再删除,避免直接覆盖已有配置或日志。
启动 Node Exporter:
nohup /opt/module/node_exporter-1.9.1/node_exporter \
  --web.listen-address=0.0.0.0:9100 \
  > /opt/module/node_exporter-1.9.1/node_exporter.log 2>&1 &
这里使用 0.0.0.0:9100 是为了实验环境访问方便。Node Exporter 会暴露大量主机信息,包括 CPU、内存、磁盘、网卡和文件系统等指标,生产环境不要直接把 9100 暴露到公网。更合适的做法是绑定内网 IP 或 127.0.0.1,远程访问通过 VPN、网关认证、Nginx Basic Auth 或防火墙限制。
检查端口:
ss -lntp | grep ':9100'输出如下:
LISTEN 0 128 *:9100 *:* users:(("node_exporter",pid=862397,fd=3))直接访问 /metrics,可以确认接口可用,并看到 Node Exporter 暴露的主机指标:
curl http://localhost:9100/metrics | head

curl http://localhost:9100/metrics \
  | egrep '^(node_cpu_seconds_total|node_memory_MemAvailable_bytes|node_filesystem_avail_bytes)' \
  | head -20
输出示例:
node_cpu_seconds_total{cpu="0",mode="idle"} 730136.92
node_cpu_seconds_total{cpu="0",mode="iowait"} 7.15
node_cpu_seconds_total{cpu="0",mode="irq"} 305.39
node_cpu_seconds_total{cpu="0",mode="nice"} 14.51
node_cpu_seconds_total{cpu="0",mode="softirq"} 114.98
node_cpu_seconds_total{cpu="0",mode="steal"} 0
node_cpu_seconds_total{cpu="0",mode="system"} 906.55
node_cpu_seconds_total{cpu="0",mode="user"} 2421.53
这里的 head 只截取前几行,所以不一定能同时看到 CPU、内存和文件系统三类指标。实际排查时可以分别按指标名前缀过滤。
如果要从浏览器临时查看 Node Exporter 原始指标,地址是 http://服务器IP:9100/metrics。这类页面不应该长期公网开放。
node_cpu_seconds_total 是一个 counter,按 CPU 核和 mode 维度累计 CPU 时间。后面做 CPU 使用率时,通常不会直接看这个累计值,而是用 rate() 或 irate() 计算一段时间内的增长速度,再按 mode 维度聚合或排除 idle。比如:
1 - avg by(instance)(rate(node_cpu_seconds_total{mode="idle"}[5m]))4. 部署 Pushgateway
Pushgateway 的部署方式也比较简单:
cd /opt/software

curl -L -o pushgateway-1.10.0.linux-amd64.tar.gz \
  https://github.com/prometheus/pushgateway/releases/download/v1.10.0/pushgateway-1.10.0.linux-amd64.tar.gz

tar -zxf pushgateway-1.10.0.linux-amd64.tar.gz -C /opt/software
mv /opt/software/pushgateway-1.10.0.linux-amd64 /opt/module/pushgateway-1.10.0
如果 /opt/module/pushgateway-1.10.0 已经存在,也一样先备份旧目录,再决定是否删除。
启动 Pushgateway:
nohup /opt/module/pushgateway-1.10.0/pushgateway \
  --web.listen-address=0.0.0.0:9091 \
  > /opt/module/pushgateway-1.10.0/pushgateway.log 2>&1 &
Pushgateway 和 Node Exporter 一样,这里监听 0.0.0.0 只是为了实验方便。更需要注意的是,Pushgateway 不只是读取页面,它还支持接收写入请求。如果把 9091 直接暴露到公网,别人可能向其中推送无效指标,污染监控数据。生产环境应绑定内网 IP 或 127.0.0.1,并通过 VPN、网关认证、防火墙或安全组限制访问。
检查端口:
ss -lntp | grep ':9091'输出如下:
LISTEN 0 128 *:9091 *:* users:(("pushgateway",pid=862398,fd=3))再确认 /metrics 接口可以访问:
curl http://localhost:9091/metrics | headPushgateway 页面地址是 http://服务器IP:9091,本机访问可以用 http://localhost:9091。这个页面和写入接口都要做好访问限制。
5. 推送一个短任务指标
假设有一个脚本任务,运行结束后只想上报两个结果:
- 最后一次成功时间。
- 累计处理数量。
可以用下面的方式把指标推到 Pushgateway:
cat <<EOF | curl --data-binary @- \
  http://localhost:9091/metrics/job/article_demo/instance/lavm-bzoq5mwl1h
# TYPE article_demo_last_success_unixtime gauge
article_demo_last_success_unixtime $(date +%s)
# TYPE article_demo_processed_total counter
article_demo_processed_total 18
EOF
这里没有给 heredoc 加单引号,所以 $(date +%s) 会在执行时展开成当前 Unix 时间戳。article_demo_processed_total 被声明为 counter,表示一个单调递增的累计值。如果只是想记录“本次处理数量”,用 gauge 会更直观,例如 article_demo_processed_count。
然后直接查看 Pushgateway 暴露的指标:
curl http://localhost:9091/metrics | egrep '^(article_demo_last_success_unixtime|article_demo_processed_total)'输出如下:
article_demo_last_success_unixtime{instance="lavm-bzoq5mwl1h",job="article_demo"} 1.74494e+09
article_demo_processed_total{instance="lavm-bzoq5mwl1h",job="article_demo"} 18
这里的 URL 路径 /metrics/job/article_demo/instance/lavm-bzoq5mwl1h 会被 Pushgateway 转换成 label:
job="article_demo"
instance="lavm-bzoq5mwl1h"
也就是说,Pushgateway 并不是简单接收一段文本,它会把推送路径中的分组信息也纳入指标标签。这个点很重要,因为后面 PromQL 查询、告警分组和 Grafana 面板都会依赖这些 label。
路径中的 label 也是 Pushgateway 的 grouping key,后续覆盖或删除这组指标时,也要使用相同路径。Pushgateway 会保留最后一次推送的指标,任务结束后指标不会自动消失,所以测试数据需要按需删除或覆盖。
打开 Pushgateway 页面,可以看到已经推送进去的指标分组:
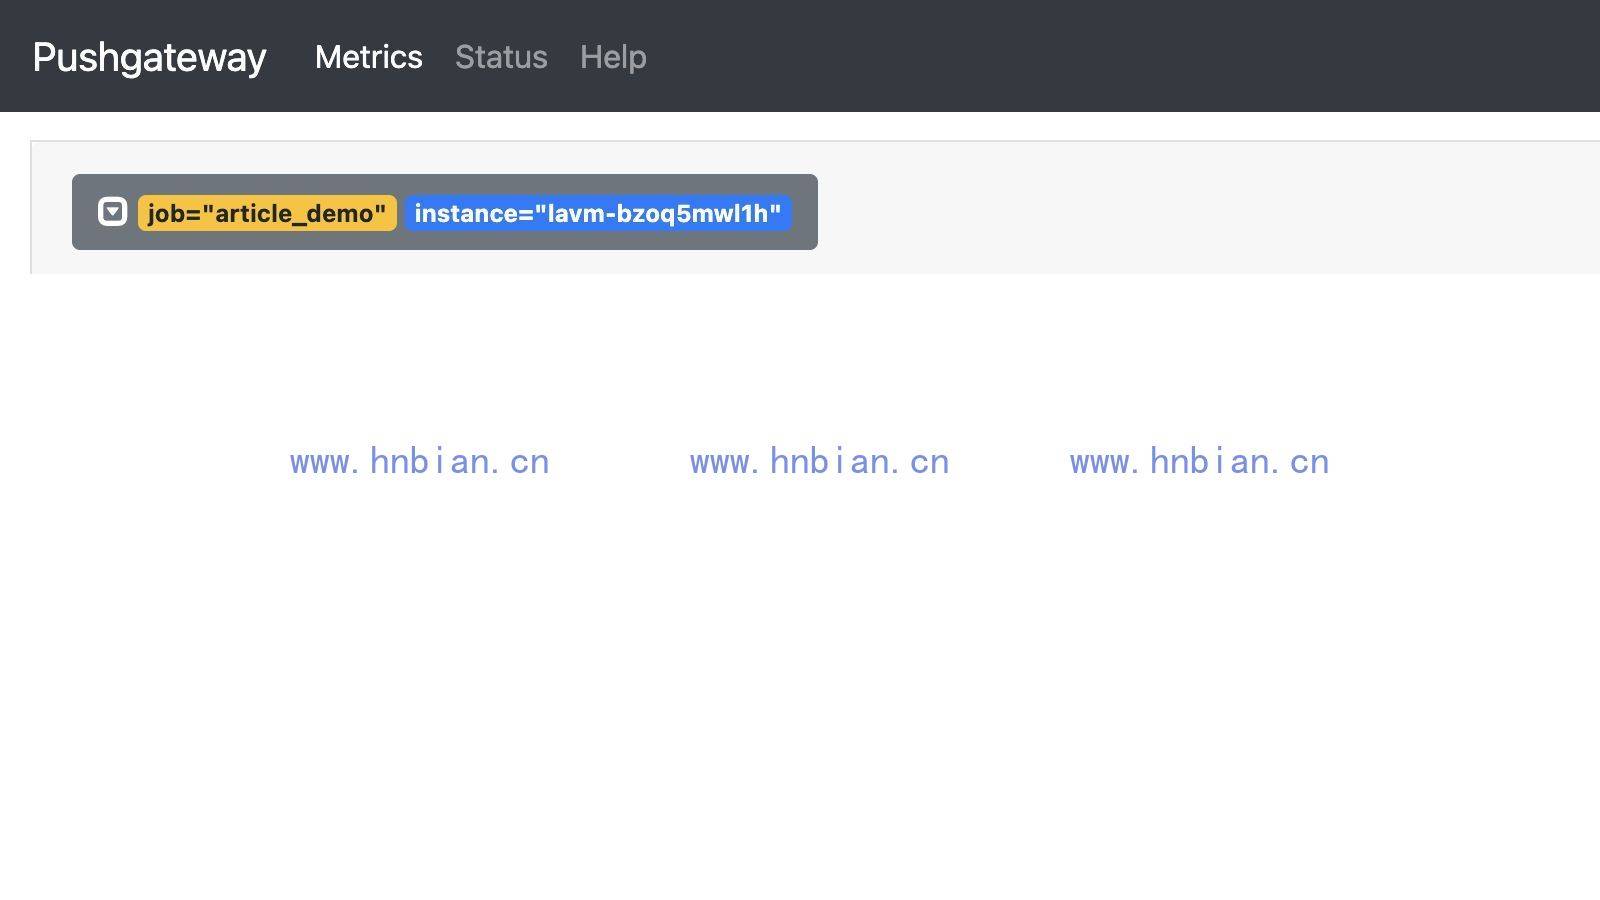
当前页面里有一组 job=”article_demo”、instance=”lavm-bzoq5mwl1h” 的指标,就是上面示例推送进去的。
如果要清理这组测试指标,可以执行:
curl -X DELETE \
  http://localhost:9091/metrics/job/article_demo/instance/lavm-bzoq5mwl1h
6. 修改 Prometheus 配置
接下来把 Node Exporter 和 Pushgateway 都加入 Prometheus 的采集配置:
cp /opt/module/prometheus-3.2.1/prometheus.yml \
   /opt/module/prometheus-3.2.1/prometheus.yml.bak

vim /opt/module/prometheus-3.2.1/prometheus.yml
完整配置如下:
global:
  scrape_interval: 15s
  evaluation_interval: 15s

scrape_configs:
  - job_name: "prometheus"
    static_configs:
      - targets: ["localhost:9090"]

  - job_name: "node_exporter"
    static_configs:
      - targets: ["localhost:9100"]

  - job_name: "pushgateway"
    honor_labels: true
    static_configs:
      - targets: ["localhost:9091"]
这里多了两个 job:
| job | target | 说明 |
|---|---|---|
| node_exporter | localhost:9100 | 采集主机指标 |
| pushgateway | localhost:9091 | 采集 Pushgateway 暂存的短任务指标 |
pushgateway 这里额外配置了 honor_labels: true。当抓取到的指标本身已经带有 job、instance 等 label 时,honor_labels: true 会保留被抓取目标中的 label;如果不设置,Prometheus 会将冲突 label 重命名为 exported_job、exported_instance,并使用 scrape 配置中的 job/instance。对于 Pushgateway 来说,这个配置很常见,否则推送路径里的 job=”article_demo” 查询起来就不直观了。
重启前先检查配置:
/opt/module/prometheus-3.2.1/promtool check config \
  /opt/module/prometheus-3.2.1/prometheus.yml
确认配置无误后再重启 Prometheus。重启期间 Prometheus 会短暂不可用,实验环境影响不大,生产环境需要谨慎操作,建议使用 systemd 管理。
pkill -f '/opt/module/prometheus-3.2.1/prometheus'

nohup /opt/module/prometheus-3.2.1/prometheus \
  --config.file=/opt/module/prometheus-3.2.1/prometheus.yml \
  --storage.tsdb.path=/opt/module/prometheus-3.2.1/data \
  --web.listen-address=0.0.0.0:9090 \
  > /opt/module/prometheus-3.2.1/prometheus.log 2>&1 &
这里的 pkill 适合实验环境快速重启,生产环境不要直接依赖这种方式。Prometheus 默认没有登录认证,0.0.0.0:9090 也只适合临时实验;如果要远程访问,地址是 http://服务器IP:9090,公网访问前必须通过 VPN、网关、Basic Auth 或防火墙限制。
7. 查看 Target 状态
进入 Prometheus 的 Status 下 Targets / Target health 页面,可以看到三个采集任务都已经变成 UP。
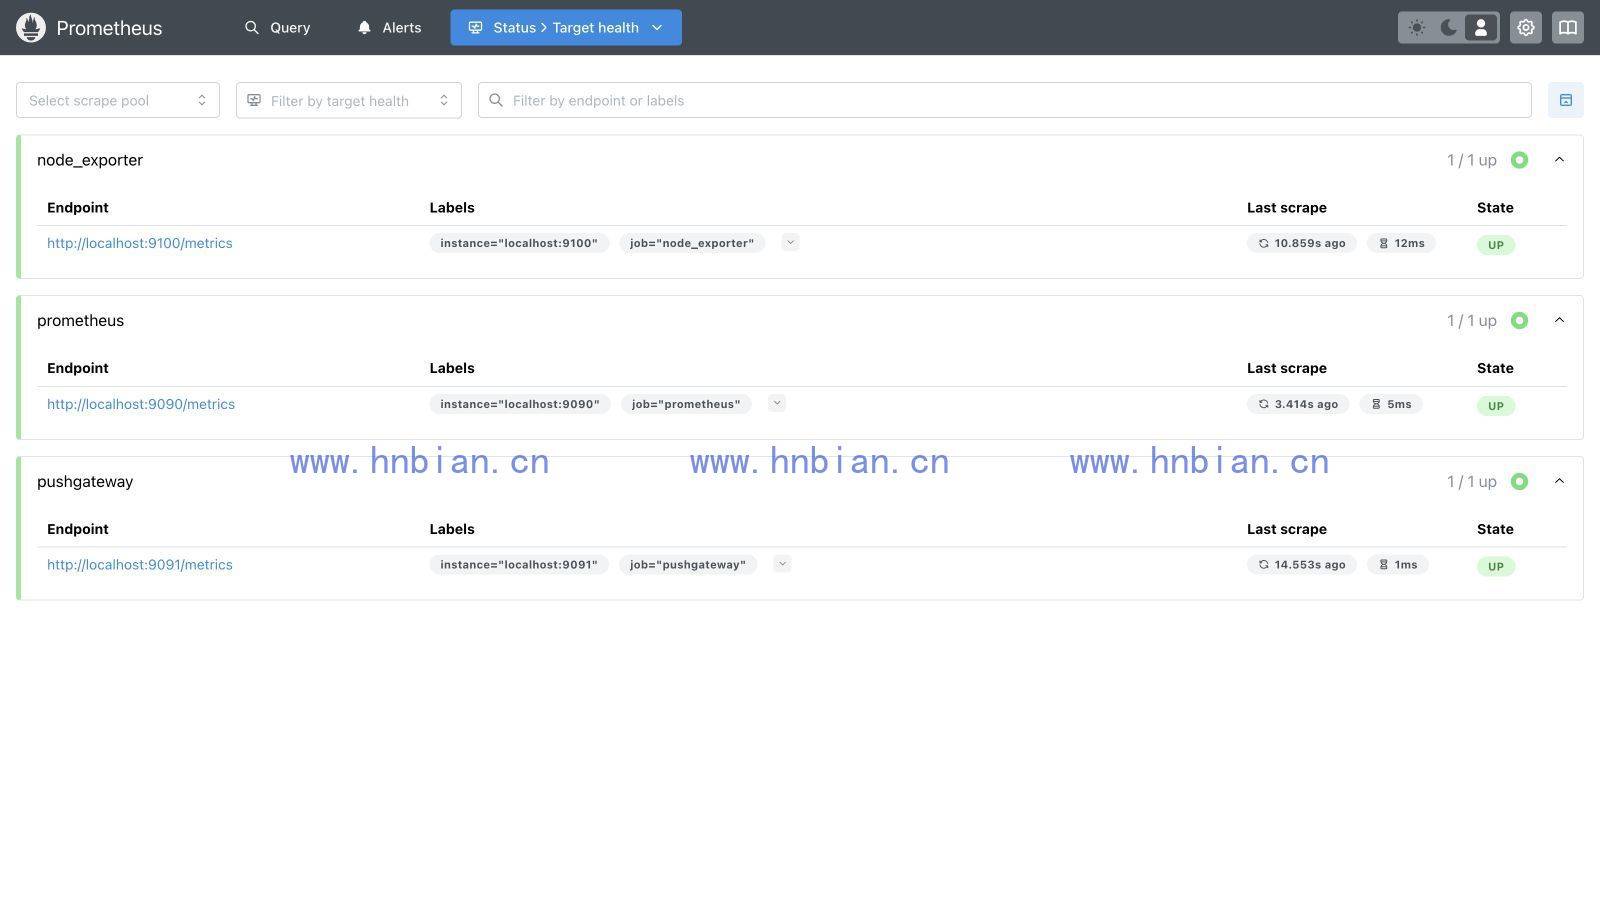
Prometheus API 中的 target 状态如下:
curl -s http://localhost:9090/api/v1/targetsAPI 原始返回是完整 JSON,下面是整理后的关键字段:
scrapeUrl="http://localhost:9100/metrics", job="node_exporter", health="up"
scrapeUrl="http://localhost:9090/metrics", job="prometheus", health="up"
scrapeUrl="http://localhost:9091/metrics", job="pushgateway", health="up"
到这里说明 Prometheus 已经能同时采集自己、主机指标和 Pushgateway 指标。
8. 查询主机指标
先看所有 target 的 up 状态:
curl -s 'http://localhost:9090/api/v1/query?query=up'完整结果中三个 target 都是 1,下面只截取其中一个 target 的 JSON 片段:
{
  "metric": {
    "__name__": "up",
    "instance": "localhost:9100",
    "job": "node_exporter"
  },
  "value": [1744940230.975, "1"]
}
再查一个主机内存指标:
curl -s 'http://localhost:9090/api/v1/query?query=node_memory_MemAvailable_bytes'页面查询结果如下:
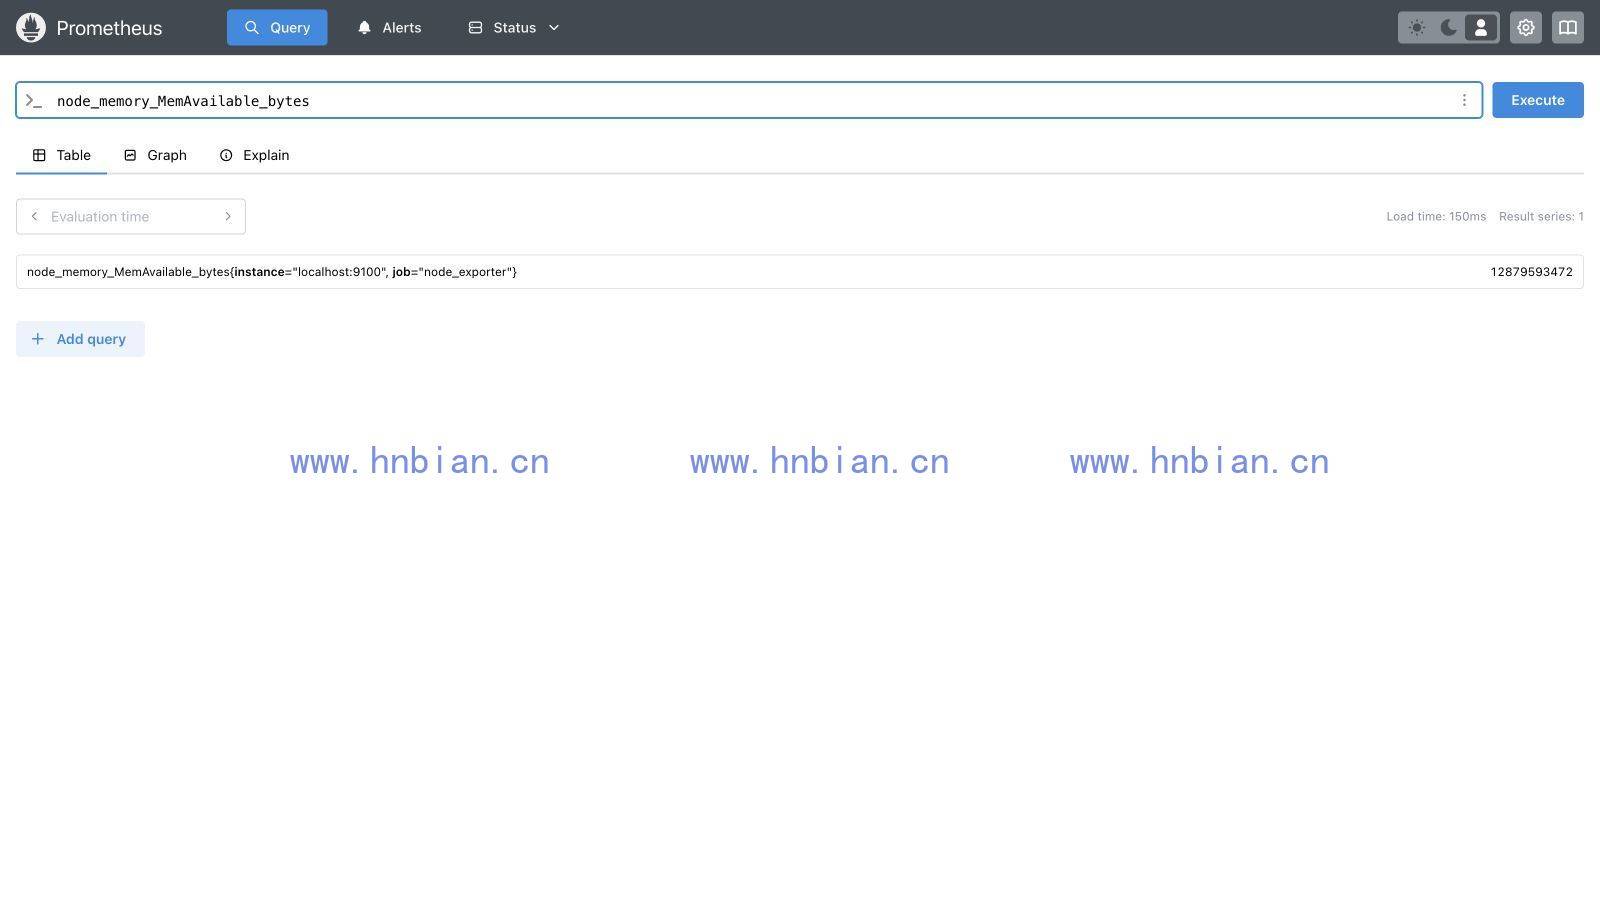
这个指标表示当前系统可用内存,单位是字节。直接看字节数不太直观,通常可以在 PromQL 里换算成 GB:
node_memory_MemAvailable_bytes / 1024 / 1024 / 1024如果要计算内存使用率,可以用:
1 - node_memory_MemAvailable_bytes / node_memory_MemTotal_bytes如果希望直接得到百分比,可以乘以 100:
(1 - node_memory_MemAvailable_bytes / node_memory_MemTotal_bytes) * 100再加几个后面常用的基础查询:
up
1 - avg by(instance)(rate(node_cpu_seconds_total{mode="idle"}[5m]))
node_filesystem_avail_bytes{mountpoint="/"} / node_filesystem_size_bytes{mountpoint="/"} * 100
这时我们就能把服务器维度的状态纳入 Prometheus 了。后面接 Grafana 时,可以搜索 Node Exporter Full 这类 Dashboard 作为主机监控面板的起点。
9. 查询 Pushgateway 指标
Pushgateway 指标被 Prometheus 采集后,也可以直接用 PromQL 查询。
curl -s 'http://localhost:9090/api/v1/query?query=article_demo_processed_total'页面查询结果如下:
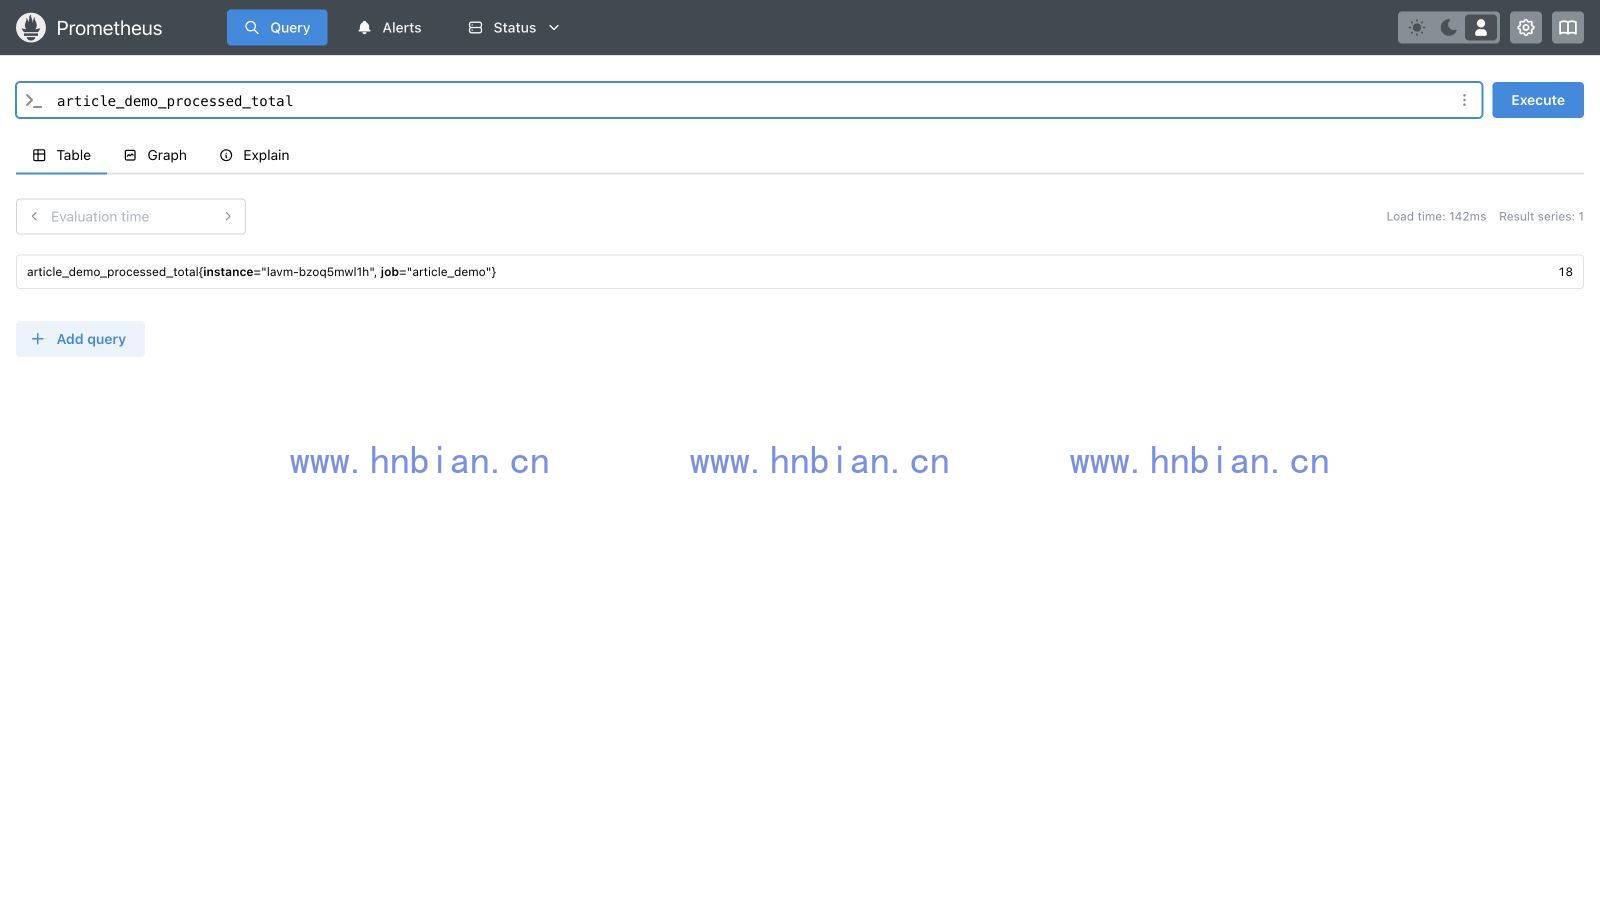
可以看到这个指标保留了推送时的 label:
article_demo_processed_total{instance="lavm-bzoq5mwl1h", job="article_demo"} 18这说明服务级别的短生命周期批处理任务不需要自己长期运行一个 /metrics 服务,只要在任务结束前把结果推给 Pushgateway,Prometheus 就能在下一轮抓取时拿到这些指标。
不过 Pushgateway 也不能滥用。对于长期运行的服务,更推荐服务自己暴露 /metrics,让 Prometheus 直接 Pull。Pushgateway 更适合“运行完就退出”的任务,不建议用于带机器实例维度的长期服务指标。它不会自动判断任务是否已经不存在,旧指标可能一直留在页面上,需要任务主动删除、覆盖,或通过运维流程定期清理。
10. 简单启动脚本
为了后面方便启动,可以把三个组件放到一个脚本里:
vim /opt/module/prometheus-3.2.1/start-monitor-base.sh内容如下:
#!/bin/bash
set -e

PROM_HOME=/opt/module/prometheus-3.2.1
NODE_HOME=/opt/module/node_exporter-1.9.1
PUSH_HOME=/opt/module/pushgateway-1.10.0

for file in \
  "${PROM_HOME}/prometheus" \
  "${NODE_HOME}/node_exporter" \
  "${PUSH_HOME}/pushgateway"; do
  if [ ! -x "$file" ]; then
    echo "missing executable: $file"
    exit 1
  fi
done

port_listening() {
  ss -lnt | awk '{print $4}' | grep -q ":$1$"
}

start_node_exporter() {
  if port_listening 9100; then
    echo "node_exporter already listens on 9100, skip"
    return
  fi

  echo "Starting node_exporter..."
  nohup ${NODE_HOME}/node_exporter \
    --web.listen-address=0.0.0.0:9100 \
    > ${NODE_HOME}/node_exporter.log 2>&1 &
}

start_pushgateway() {
  if port_listening 9091; then
    echo "pushgateway already listens on 9091, skip"
    return
  fi

  echo "Starting pushgateway..."
  nohup ${PUSH_HOME}/pushgateway \
    --web.listen-address=0.0.0.0:9091 \
    > ${PUSH_HOME}/pushgateway.log 2>&1 &
}

start_prometheus() {
  if port_listening 9090; then
    echo "prometheus already listens on 9090, skip"
    return
  fi

  echo "Starting prometheus..."
  nohup ${PROM_HOME}/prometheus \
    --config.file=${PROM_HOME}/prometheus.yml \
    --storage.tsdb.path=${PROM_HOME}/data \
    --web.listen-address=0.0.0.0:9090 \
    > ${PROM_HOME}/prometheus.log 2>&1 &
}

start_node_exporter
start_pushgateway
start_prometheus

sleep 2
ss -lntp | egrep ':9090|:9091|:9100' || true
添加执行权限:
chmod +x /opt/module/prometheus-3.2.1/start-monitor-base.sh这个脚本假设三个组件已经按前文安装到对应目录,启动前会检查可执行文件是否存在。实验环境里这样已经够用。如果是长期运行环境,还是建议改成 systemd 服务,方便统一管理重启策略和日志。
停止时可以按进程路径处理:
pkill -f '/opt/module/node_exporter-1.9.1/node_exporter'
pkill -f '/opt/module/pushgateway-1.10.0/pushgateway'
pkill -f '/opt/module/prometheus-3.2.1/prometheus'
这种停止方式仍然偏实验化。长期运行建议改成 systemd,方便配置开机自启、失败自动重启和统一日志管理。
11. 小结
这篇在上一篇 Prometheus Server 的基础上,继续补了两个基础组件:
- Node Exporter 用来采集 Linux 主机指标。
- Pushgateway 用来暂存短生命周期任务主动推送的指标。
- Prometheus 中新增了 node_exporter 和 pushgateway 两个采集任务。
- 通过 up、node_memory_MemAvailable_bytes 和 article_demo_processed_total 验证了采集链路。
到这里,Prometheus 已经不只是监控自己,还可以看到服务器基础资源,并且能接收短任务上报结果。下一篇可以继续整理 PromQL 的常用查询方式,把这些原始指标变成更接近排查场景的表达式。