前面整理 YARN 的时候,更多关注的是 ResourceManager、NodeManager、Application、Container 这些对象本身。通过 Web UI 和命令行可以看到应用状态、队列资源、节点健康和日志,但是这种方式更偏“事后查看”。如果想持续观察服务是否存活、接口是否正常、指标是否突增,就需要补一套独立的指标采集系统。
Prometheus 比较适合做这件事。它本身是一个时间序列数据库,也是一套指标采集和查询系统。被监控服务只要暴露 /metrics 接口,Prometheus 就可以按固定周期去拉取指标,然后通过 PromQL 查询这些指标。后面如果接入 Grafana,就可以把这些指标做成看板;如果接入 Alertmanager 或其他告警通道,就可以在指标异常时通知出来。
这篇先不接入 Hadoop、YARN、Flink 的具体指标,只完成 Prometheus Server 本身的部署,并让 Prometheus 先监控自己。这个步骤看起来简单,但它能把最核心的链路跑通:配置采集目标、启动服务、查看 target 状态、执行 PromQL 查询。
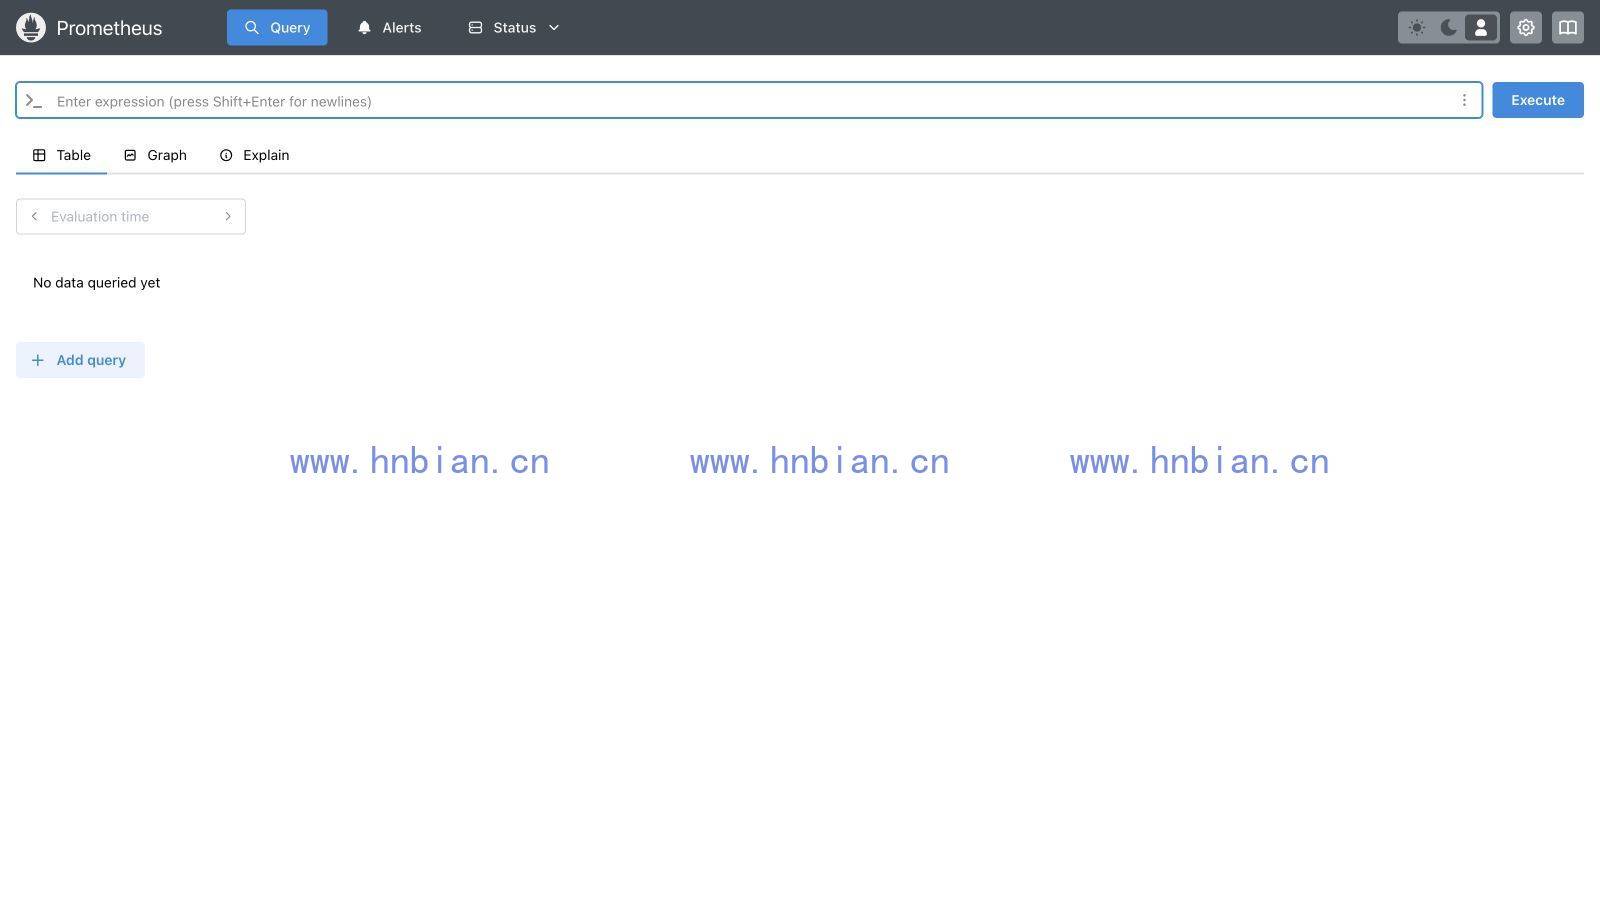
Prometheus 默认不启用认证和登录页面,服务启动后访问 http://服务器IP:9090 即可进入 Web UI,因此需要注意访问控制。
1. Prometheus 监控模型
先来看 Prometheus 里几个常见对象。
| 对象 | 作用 |
|---|---|
| Prometheus Server | 负责按配置抓取指标、存储时间序列数据、执行 PromQL 查询 |
| Target | 被采集目标,例如一个服务的 /metrics 地址 |
| Exporter | 指标适配组件,负责把系统、数据库、中间件等状态转换成 Prometheus 指标格式 |
| TSDB | Prometheus 内置的时间序列存储 |
| PromQL | Prometheus 查询语言,用来过滤、聚合、计算指标 |
| Alertmanager | 告警处理组件,负责分组、抑制、静默和发送通知 |
| Grafana | 可视化工具,通常用来展示 Prometheus 指标 |
如果从整体链路看,可以先把 Prometheus 监控体系理解成下面这样:
被监控服务 / Exporter -> Prometheus Server -> PromQL / Grafana / Alertmanager被监控服务或 Exporter 负责暴露指标,Prometheus 负责定期采集和存储指标,PromQL 用来查询和计算指标,Grafana 负责可视化,Alertmanager 负责告警通知。
Prometheus 默认采用 Pull 模型。也就是说,不是被监控服务主动把指标发给 Prometheus,而是 Prometheus 根据 prometheus.yml 中的配置,定期访问每个 target 的指标接口。
这个模型有几个好处:
- Prometheus 可以清楚地知道哪些目标正在被采集。
- 每个 target 的健康状态可以直接在页面中看到。
- 采集周期、超时时间、标签等信息都集中在 Prometheus 侧管理。
当然,并不是所有任务都适合 Pull。比如一些生命周期很短的批处理任务,运行几秒就结束了,Prometheus 还没来得及抓取任务就已经退出。这类场景通常会引入 Pushgateway,由短任务把指标先推到 Pushgateway,再由 Prometheus 去采集 Pushgateway。
不过 Pushgateway 不是通用的 Push 模型替代方案,不适合替代普通服务的指标采集,也不建议长期存放带实例维度的常规服务指标。长期运行的服务仍然应该优先暴露 /metrics,让 Prometheus 直接拉取。
2. 环境说明
本次部署直接放在之前的 Hadoop/YARN 实验服务器上。服务器已经有 Java 和 Hadoop 环境,这里只新增 Prometheus。
hostname
date '+%Y-%m-%d %H:%M:%S'
java -version
/opt/hadoop/bin/hadoop version
关键环境如下:
lavm-bzoq5mwl1h
2025-04-07 21:13:38

openjdk version "11.0.13" 2021-10-19 LTS

Hadoop 3.4.1
这篇只部署 Prometheus,所以先确认几个常用端口。下面这些端口是当前实验服务器上已有的大数据组件端口,本文只会用到 9090,其他端口留作后续接入时参考:
| 端口 | 组件 | 说明 |
|---|---|---|
| 9090 | Prometheus | Web UI 和 HTTP API |
| 8088 | ResourceManager | YARN Web UI |
| 8042 | NodeManager | NodeManager Web UI |
| 19888 | JobHistoryServer | MapReduce 历史服务 |
为了避免调试时端口混乱,Prometheus 使用默认的 9090 端口。
3. 下载并解压 Prometheus
Prometheus 是 Go 编译出来的二进制程序,不依赖额外数据库。下载对应系统架构的压缩包,解压后就可以直接启动。
这里使用 3.2.1 作为示例版本。如果阅读时已经有更新版本,可以到 Prometheus GitHub Releases 页面替换为更新的稳定版本。包名里的 linux-amd64 对应 x86_64 服务器,如果是 ARM64 服务器,需要选择 linux-arm64 包。
mkdir -p /opt/software /opt/module
cd /opt/software

curl -L -o prometheus-3.2.1.linux-amd64.tar.gz \
  https://github.com/prometheus/prometheus/releases/download/v3.2.1/prometheus-3.2.1.linux-amd64.tar.gz

tar -zxf prometheus-3.2.1.linux-amd64.tar.gz -C /opt/software
mv /opt/software/prometheus-3.2.1.linux-amd64 /opt/module/prometheus-3.2.1
这里先下载到 /opt/software,再移动到 /opt/module,只是为了把安装包和运行目录区分开。也可以直接解压到 /opt/module 后重命名,效果是一样的。
查看版本:
/opt/module/prometheus-3.2.1/prometheus --version输出如下:
prometheus, version 3.2.1 (branch: HEAD, revision: 804c49d58f3f3784c77c9c8ec17c9062092cae27)
  build user:       root@42fd9529152a
  build date:       20250226-09:19:49
可以看到当前使用的是 3.2.1,构建时间是 2025-02-26。这套版本用于当前实验环境已经够用,后续如果接入更多组件,只需要继续扩展采集配置。
4. 配置 prometheus.yml
Prometheus 的核心配置文件是 prometheus.yml。先使用最小配置,只采集 Prometheus 自己。
cd /opt/module/prometheus-3.2.1
cp prometheus.yml prometheus.yml.bak
vim prometheus.yml
配置内容如下:
global:
  scrape_interval: 15s
  evaluation_interval: 15s

scrape_configs:
  - job_name: "prometheus"
    static_configs:
      - targets: ["localhost:9090"]
几个参数的含义如下:
| 配置 | 说明 |
|---|---|
| scrape_interval | 默认采集间隔,这里设置为 15 秒 |
| evaluation_interval | 规则计算间隔,后续配置告警规则时会用到 |
| scrape_configs | 采集任务列表 |
| job_name | 采集任务名称,会作为指标标签的一部分 |
| targets | 具体采集地址 |
这里的 localhost:9090 指向 Prometheus 自己。Prometheus 启动后,会在自己的 /metrics 接口暴露运行指标,然后再由自己采集这些指标。
从本质上看,这就是一个最小闭环:
Prometheus Server -> http://localhost:9090/metrics -> TSDB -> PromQL这里的 /metrics 是 Prometheus 自己暴露的指标接口,不代表所有服务默认都有这个路径。其他组件可能需要额外启用指标接口,或者通过 Exporter 把指标转换成 Prometheus 可以识别的文本格式。
只要这个闭环是通的,后面添加 Node Exporter、Flink、Hadoop JMX Exporter 或其他组件时,只是在 scrape_configs 里继续追加 target。
启动前先用 promtool 校验配置:
/opt/module/prometheus-3.2.1/promtool check config \
  /opt/module/prometheus-3.2.1/prometheus.yml
输出如下:
Checking /opt/module/prometheus-3.2.1/prometheus.yml
 SUCCESS: /opt/module/prometheus-3.2.1/prometheus.yml is valid prometheus config file syntax
5. 启动 Prometheus
先用前台方式启动,方便观察日志:
cd /opt/module/prometheus-3.2.1

./prometheus \
  --config.file=/opt/module/prometheus-3.2.1/prometheus.yml \
  --storage.tsdb.path=/opt/module/prometheus-3.2.1/data \
  --web.listen-address=0.0.0.0:9090
确认日志无报错后,按 Ctrl+C 停止前台进程,再改成后台启动:
nohup /opt/module/prometheus-3.2.1/prometheus \
  --config.file=/opt/module/prometheus-3.2.1/prometheus.yml \
  --storage.tsdb.path=/opt/module/prometheus-3.2.1/data \
  --web.listen-address=0.0.0.0:9090 \
  > /opt/module/prometheus-3.2.1/prometheus.log 2>&1 &
这里使用 0.0.0.0:9090 是为了实验环境访问方便。如果是生产环境,不建议直接把 Prometheus 暴露到公网;更稳妥的做法是只绑定 127.0.0.1 或内网地址,对外访问通过 Nginx、网关、VPN、Basic Auth 或防火墙/安全组限制。云服务器如果只在本机验证,不需要开放公网安全组;如果要从远程浏览器访问 9090,安全组和系统防火墙需要允许访问,但开放前必须先做好访问控制。
后台启动后可以继续看日志:
tail -f /opt/module/prometheus-3.2.1/prometheus.logPrometheus 会把时序数据写入 –storage.tsdb.path 指定的目录,这里是 /opt/module/prometheus-3.2.1/data。长期运行时这个目录会持续增长,需要关注磁盘空间。后续可以通过保留时间或保留大小控制数据量,例如:
--storage.tsdb.retention.time=15d查看端口:
ss -lntp | grep ':9090'输出如下:
LISTEN 0 128 *:9090 *:* users:(("prometheus",pid=858793,fd=6))再看 Prometheus 的健康检查和 ready 接口:
curl http://localhost:9090/-/healthy
curl http://localhost:9090/-/ready
输出如下:
Prometheus Server is Healthy.
Prometheus Server is Ready.
到这里说明 Prometheus Server 已经正常启动。
6. 查看 Target 状态
浏览器访问地址可以使用:
http://服务器IP:9090如果是在服务器本机验证,也可以访问:
http://localhost:9090打开 Prometheus 页面后,进入 Status 下的 Targets / Target health 页面,可以看到当前只有一个采集任务。
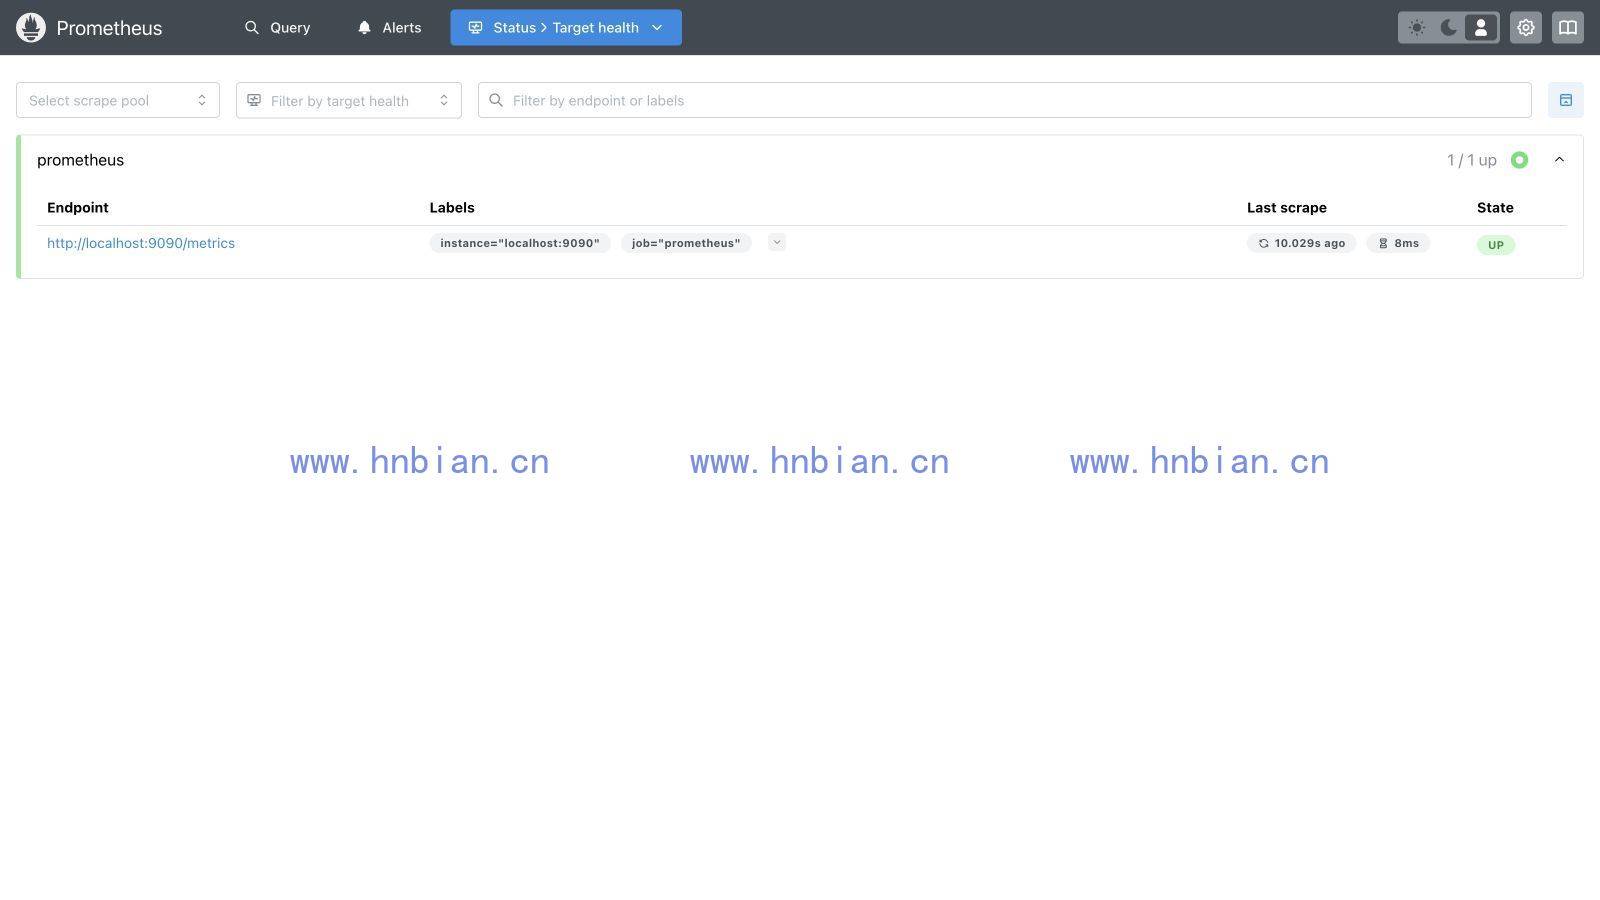
这个页面最重要的是看 target 的健康状态。当前 prometheus 这个 scrape pool 下只有一个 endpoint:
http://localhost:9090/metricsPrometheus API 返回的 target 状态如下:
curl http://localhost:9090/api/v1/targets关键字段如下:
{
  "labels": {
    "instance": "localhost:9090",
    "job": "prometheus"
  },
  "scrapeUrl": "http://localhost:9090/metrics",
  "lastError": "",
  "lastScrape": "2025-04-07T21:13:25.761562693+08:00",
  "health": "up",
  "scrapeInterval": "15s",
  "scrapeTimeout": "10s"
}
lastScrape 表示最近一次采集时间,实际值以自己的环境为准,不需要和这里完全一致。
这里可以重点看三个字段:
- scrapeUrl 表示 Prometheus 实际访问的指标地址。
- lastError 为空,说明最近一次采集没有错误。
- health 为 up,说明 target 当前健康。
如果后续接入其他组件时 target 状态不是 up,排查顺序通常是:先在 Prometheus 服务器上 curl 目标 /metrics,再检查端口、防火墙、服务地址、metrics path 和 label 配置。
7. 常见问题排查
这里先把最常见的几类问题放一下,后面接入更多 target 时也会反复用到。
| 现象 | 排查方式 |
|---|---|
| 9090 端口没有监听 | 使用 ps -ef |
| Prometheus 启动后马上退出 | 使用 promtool check config prometheus.yml 检查配置文件 |
| target 状态为 down | 在 Prometheus 所在服务器上直接 curl http://target/metrics |
| 远程浏览器打不开页面 | 检查云服务器安全组、系统防火墙和 Prometheus 监听地址 |
| 页面能打开但没有指标 | 检查 scrape_configs、target 地址、metrics path 和服务自身指标接口 |
8. 使用 PromQL 验证指标
Prometheus 采集成功后,就可以用 PromQL 查询指标。最常用的验证表达式是 up。
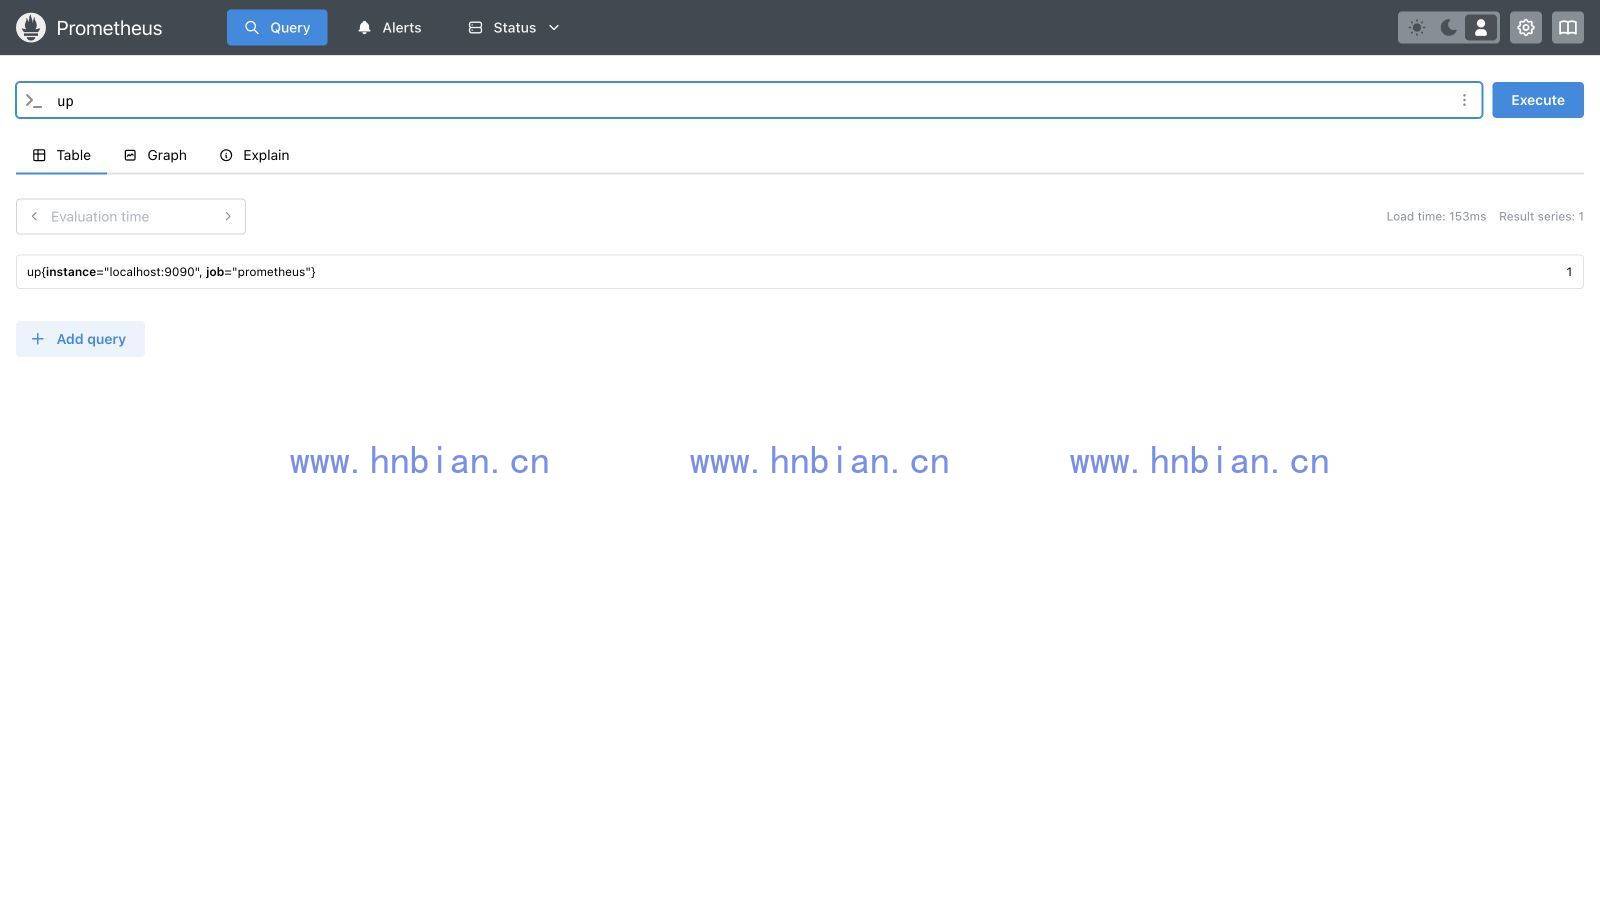
curl 'http://localhost:9090/api/v1/query?query=up'输出如下:
{
  "status": "success",
  "data": {
    "resultType": "vector",
    "result": [
      {
        "metric": {
          "__name__": "up",
          "instance": "localhost:9090",
          "job": "prometheus"
        },
        "value": [1744031618.632, "1"]
      }
    ]
  }
}
up 是 Prometheus 自动生成的指标。对于每个 target:
| 值 | 含义 |
|---|---|
| 1 | 最近一次采集成功 |
| 0 | 最近一次采集失败 |
所以这里的 up{job=”prometheus”, instance=”localhost:9090”} = 1,就说明 Prometheus 已经成功采集到了自己的指标。
再查一个 Prometheus 自身的 HTTP 请求指标:
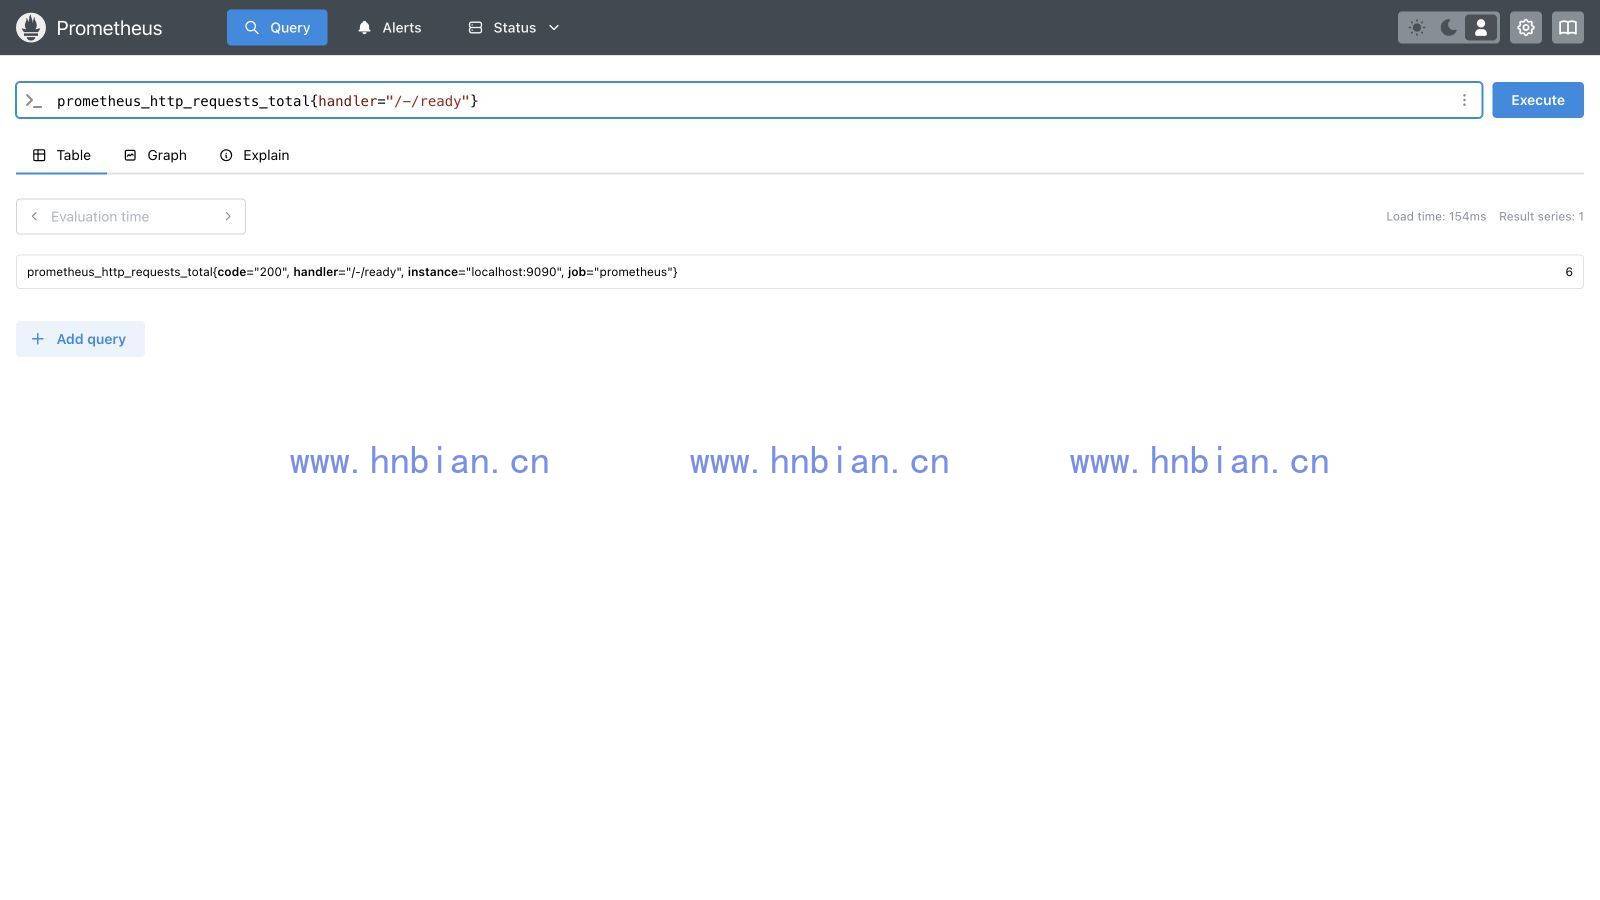
curl 'http://localhost:9090/api/v1/query?query=prometheus_http_requests_total'部分结果如下:
{
  "metric": {
    "__name__": "prometheus_http_requests_total",
    "code": "200",
    "handler": "/-/ready",
    "instance": "localhost:9090",
    "job": "prometheus"
  },
  "value": [1744031618.638, "2"]
}
这个指标表示 Prometheus HTTP 接口的请求次数。比如这里的 handler=”/-/ready” 对应前面访问 ready 接口产生的请求。它只是一个示例指标,实际返回内容会根据访问过的页面、接口和 Prometheus 版本不同而变化,不需要和这里的 handler 完全一致。
通过这个例子可以看到,Prometheus 的指标通常不是一个孤立的数值,而是由指标名和一组 label 共同描述。
例如:
prometheus_http_requests_total{
  code="200",
  handler="/-/ready",
  instance="localhost:9090",
  job="prometheus"
}
后面做 Flink、YARN、主机监控时,也会遇到类似结构。理解 label 很重要,因为 PromQL 的过滤、分组、聚合基本都是围绕 label 做的。
9. 简单启动脚本
为了后面方便启动,可以先写一个简单脚本:
vim /opt/module/prometheus-3.2.1/start-prometheus.sh内容如下:
#!/bin/bash

PROM_HOME=/opt/module/prometheus-3.2.1
PROM_BIN=${PROM_HOME}/prometheus
PROM_PORT=9090

if ss -lnt | grep -q ":${PROM_PORT} "; then
  echo "port ${PROM_PORT} is already listening, prometheus may already be running"
  exit 0
fi

if pgrep -f "${PROM_BIN}" >/dev/null 2>&1; then
  echo "prometheus process already exists"
  exit 0
fi

nohup ${PROM_BIN} \
  --config.file=${PROM_HOME}/prometheus.yml \
  --storage.tsdb.path=${PROM_HOME}/data \
  --web.listen-address=0.0.0.0:9090 \
  > ${PROM_HOME}/prometheus.log 2>&1 &
添加执行权限:
chmod +x /opt/module/prometheus-3.2.1/start-prometheus.sh停止时可以先按进程名处理:
pkill -f '/opt/module/prometheus-3.2.1/prometheus'当前只是实验环境,这种脚本已经够用。pkill 方式比较直接,生产环境不建议这样管理 Prometheus,更建议写成 systemd 服务,这样可以统一管理开机自启、日志和异常重启。
10. 小结
这一篇先完成了 Prometheus Server 的最小部署,并让 Prometheus 采集了自己的 /metrics 接口。整个链路包括:
- 下载并解压 Prometheus。
- 编写 prometheus.yml。
- 启动 9090 Web 服务。
- 在 Target 页面确认 prometheus 为 up。
- 使用 up 和 prometheus_http_requests_total 验证 PromQL 查询。
到这里,监控系统的底座已经搭起来了。下一步可以先接入 Node Exporter 采集主机 CPU、内存、磁盘、网络等指标;如果后续有短生命周期任务,再单独引入 Pushgateway。